Mastering Linux System Monitoring with htop, iostat, and sar
System monitoring is crucial for maintaining healthy Linux servers and identifying performance bottlenecks before they impact your applications. This guide covers essential monitoring tools that every Linux administrator should master.
Why System Monitoring Matters
Effective monitoring helps you:
- Identify resource bottlenecks early
- Plan capacity upgrades
- Troubleshoot performance issues
- Optimize system configuration
- Maintain service availability
htop: Interactive Process Viewer
htop is an enhanced version of the traditional top command, providing a more user-friendly interface for monitoring system processes.
Installation
# Ubuntu/Debian
sudo apt install htop -y

# CentOS/RHEL/Rocky Linux
sudo yum install htop -y

# Arch Linux
sudo pacman -S htop
Basic Usage
Simply run:
htop
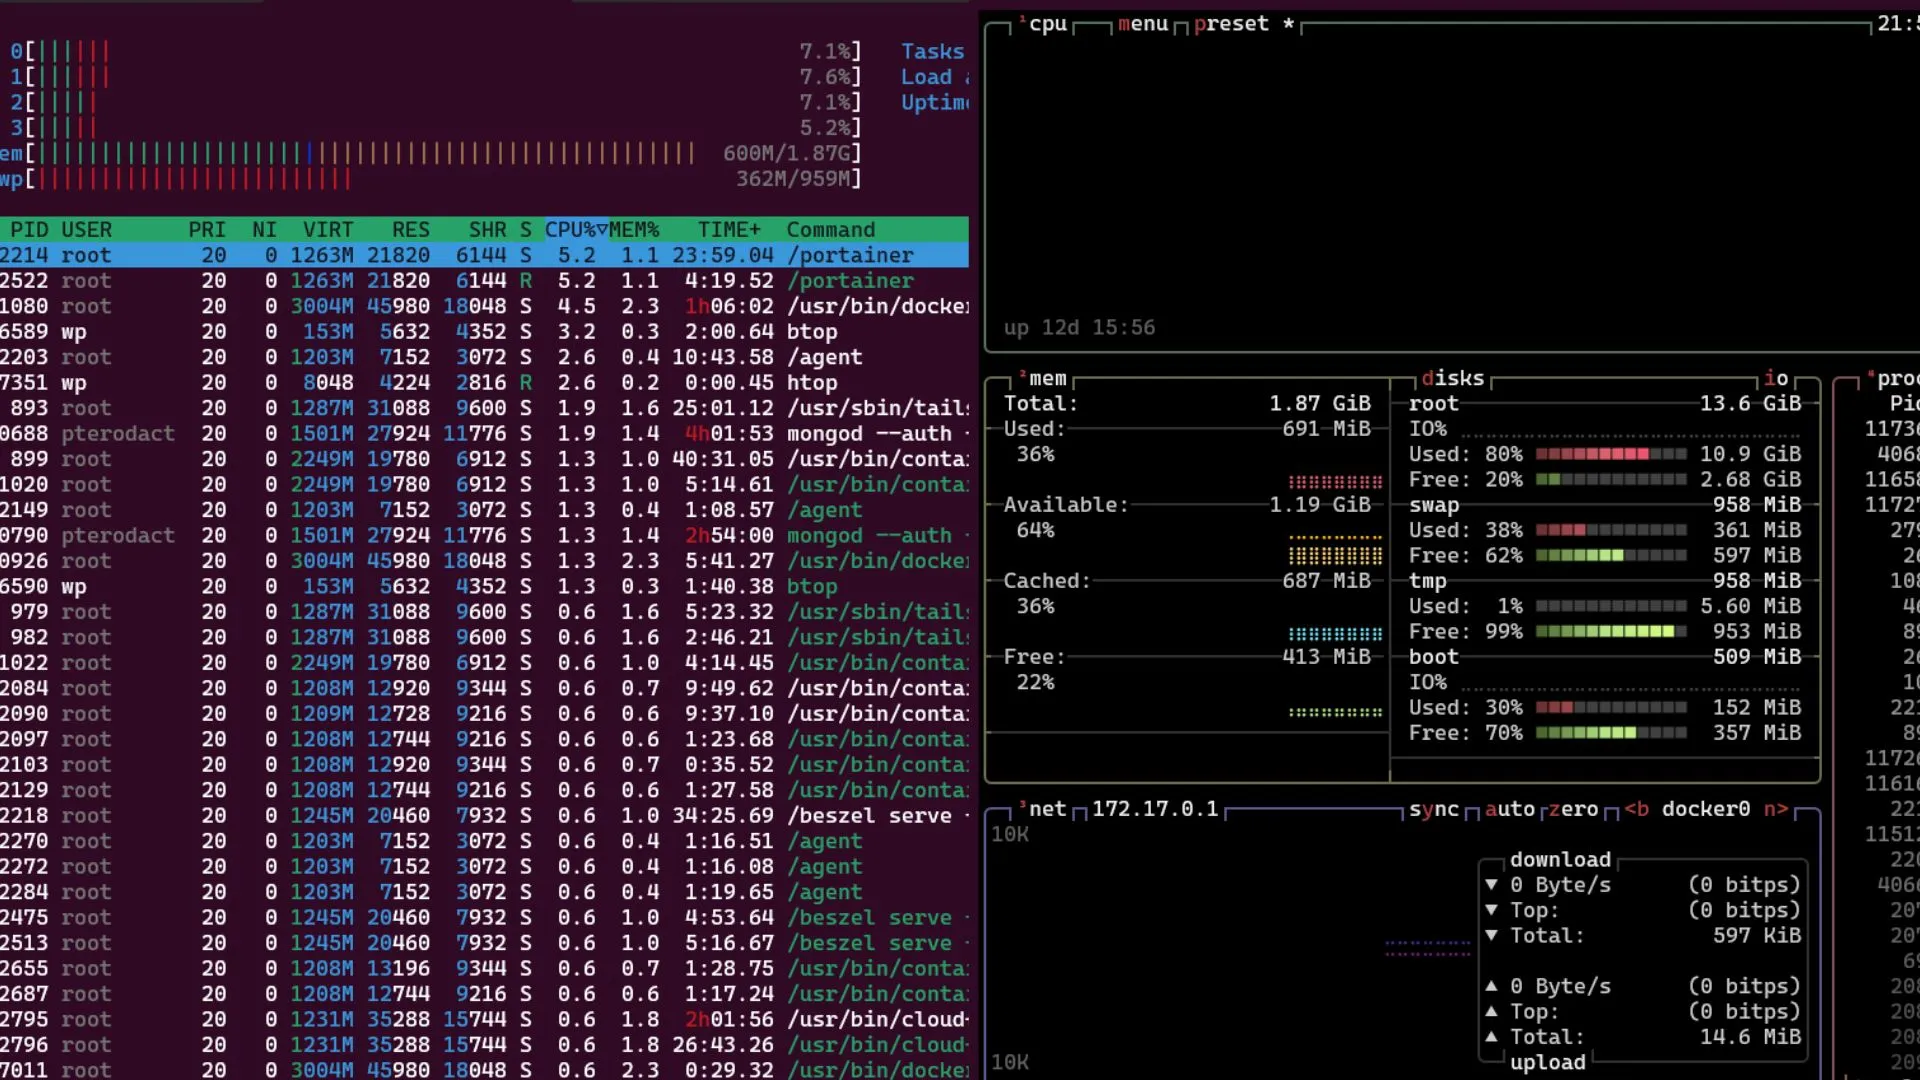
Understanding the htop Interface
Header Section
- CPU Usage: Shows per-core CPU utilization with color coding
- Memory: RAM and swap usage with visual bars
- Load Average: 1, 5, and 15-minute load averages
- Tasks: Number of total, running, sleeping, stopped, and zombie processes
- Uptime: System uptime information
Color Coding
- Blue: Low-priority processes
- Green: Normal user processes
- Red: Kernel processes
- Yellow: IRQ time
- Magenta: Soft IRQ time
- Cyan: Steal time (virtualized environments)
Key Commands in htop
# Navigation
↑/↓         # Navigate process list
Home/End    # Jump to top/bottom
PgUp/PgDn   # Page up/down

# Sorting
F6 or >     # Sort by different columns
P           # Sort by CPU usage
M           # Sort by memory usage
T           # Sort by TIME+

# Process Management
F9 or k     # Kill selected process
F7/F8       # Change process priority
F4 or \     # Filter processes
F5 or t     # Tree view toggle

# Display Options
F2          # Setup screen
H           # Hide/show user threads
K           # Hide/show kernel threads
Customizing htop
Press F2 to access setup options:
- Colors: Choose color schemes
- Display Options: Show/hide various elements
- Columns: Add/remove columns like PPID, USER, PRIORITY
- Meters: Customize header layout
htop Configuration File
htop saves configuration in ~/.config/htop/htoprc:
# View current configuration
cat ~/.config/htop/htoprc

# Reset to defaults
rm ~/.config/htop/htoprc
iostat: I/O Statistics
iostat provides detailed input/output statistics for devices and partitions, helping identify storage bottlenecks.
Installation
iostat is part of the sysstat package:
# Ubuntu/Debian
sudo apt install sysstat -y

# CentOS/RHEL/Rocky Linux
sudo yum install sysstat -y
Basic Usage
# Basic I/O statistics
iostat

# Extended statistics every 2 seconds
iostat -x 2

# Monitor specific device
iostat -x sda 1

# Show statistics since boot
iostat -x 1 1
Understanding iostat Output
Device Statistics
Device            r/s     w/s     rkB/s     wkB/s   rrqm/s   wrqm/s  %rrqm  %wrqm     r_await    w_await aqu-sz rareq-sz wareq-sz  svctm  %util
sda              1.25    2.30     45.23    123.45     0.12     0.45   8.76  16.38        2.34       4.56   0.01    36.18    53.67   1.23   0.45
Key metrics:
- r/s, w/s: Reads/writes per second
- rkB/s, wkB/s: Kilobytes read/written per second
- %util: Percentage of time device was busy
- await: Average time for I/O requests (milliseconds)
- svctm: Average service time
Useful iostat Commands
# Show extended statistics for all devices
iostat -x

# Monitor every 5 seconds, 12 times
iostat -x 5 12

# Show statistics for specific devices
iostat -x sda sdb 2

# Include timestamps
iostat -xt 1

# Show CPU and device statistics
iostat -c -d 2
Interpreting Performance Issues
High %util
- Indicates storage bottleneck
- Consider faster storage or load balancing
High await/svctm
- Slow response times
- Check for failing drives or overloaded storage
High r/s or w/s with low throughput
- Many small I/O operations
- Consider optimizing application I/O patterns
sar: System Activity Reporter
sar collects and reports system activity information, providing historical data for performance analysis.
Basic Usage
# Current CPU usage
sar

# CPU usage every 2 seconds, 5 times
sar 2 5

# Memory usage
sar -r

# I/O statistics
sar -b

# Network statistics
sar -n DEV
Common sar Options
CPU Monitoring
# Overall CPU usage
sar -u 1 10

# Per-CPU statistics
sar -P ALL 1 5

# CPU usage for specific CPU
sar -P 0 1 5
Memory Monitoring
# Memory utilization
sar -r 1 10

# Memory statistics including buffers/cache
sar -R 1 5

# Swap space utilization
sar -S 1 10
I/O Monitoring
# I/O transfer rates
sar -b 1 10

# Block device statistics
sar -d 1 10

# Specific device monitoring
sar -d -p 1 10
Network Monitoring
# Network interface statistics
sar -n DEV 1 10

# Network error statistics
sar -n EDEV 1 10

# TCP statistics
sar -n TCP 1 10

# UDP statistics
sar -n UDP 1 10
Historical Data Analysis
sar stores historical data in /var/log/sysstat/ (or /var/log/sa/):
# View yesterday's CPU data
sar -u -f /var/log/sysstat/saDD

# View specific time range
sar -r -s 10:00:00 -e 18:00:00

# Generate daily report
sar -A > daily_report.txt
Setting Up Data Collection
Enable automatic data collection by editing /etc/cron.d/sysstat:
# Collect data every 10 minutes
*/10 * * * * root /usr/lib64/sa/sa1 1 1

# Generate daily reports
53 23 * * * root /usr/lib64/sa/sa2 -A
Advanced Monitoring Techniques
Combining Tools for Comprehensive Analysis
Real-time Performance Script
#!/bin/bash
# performance_monitor.sh

echo "=== System Performance Monitor ==="
echo "Date: $(date)"
echo

echo "=== CPU Usage ==="
sar -u 1 1 | tail -n 1

echo "=== Memory Usage ==="
sar -r 1 1 | tail -n 1

echo "=== I/O Statistics ==="
iostat -x 1 1 | grep -A 20 "Device"

echo "=== Top Processes ==="
ps aux --sort=-%cpu | head -6

echo "=== Load Average ==="
uptime
Performance Alert Script
#!/bin/bash
# alert_monitor.sh

CPU_THRESHOLD=80
MEM_THRESHOLD=85
DISK_THRESHOLD=90

# Check CPU usage
CPU_USAGE=$(sar -u 1 1 | tail -1 | awk '{print 100-$8}')
if (( $(echo "$CPU_USAGE > $CPU_THRESHOLD" | bc -l) )); then
    echo "ALERT: High CPU usage: $CPU_USAGE%"
fi

# Check memory usage
MEM_USAGE=$(free | grep Mem | awk '{printf "%.1f", $3/$2 * 100.0}')
if (( $(echo "$MEM_USAGE > $MEM_THRESHOLD" | bc -l) )); then
    echo "ALERT: High memory usage: $MEM_USAGE%"
fi

# Check disk usage
df -h | awk 'NR>1 {gsub(/%/,"",$5); if($5 > '$DISK_THRESHOLD') print "ALERT: High disk usage on " $6 ": " $5"%"}'
Creating Custom Monitoring Dashboards
Simple Web Dashboard with HTML
<!DOCTYPE html>
<html>
<head>
    <title>System Monitor</title>
    <meta http-equiv="refresh" content="30">
</head>
<body>
    <h1>System Performance Dashboard</h1>
    <pre id="stats">
        <!-- Auto-refreshed system stats -->
    </pre>
    <script>
        // Add JavaScript for real-time updates
    </script>
</body>
</html>
Best Practices
1. Regular Monitoring Schedule
- Check system performance daily
- Review weekly trends
- Analyze monthly patterns
- Plan capacity based on historical data
2. Set Up Alerts
- Configure thresholds for critical metrics
- Use email or SMS notifications
- Implement escalation procedures
- Document response procedures
3. Baseline Performance
- Record normal operating parameters
- Document seasonal variations
- Track performance after changes
- Maintain performance history
4. Tool Selection Strategy
- Use htop for real-time process monitoring
- Use iostat for storage performance analysis
- Use sar for historical trend analysis
- Combine tools for comprehensive monitoring
Troubleshooting Common Issues
High CPU Usage
# Identify CPU-intensive processes
htop (sort by CPU)
ps aux --sort=-%cpu | head -10

# Check for runaway processes
sar -u 1 10
Memory Issues
# Check memory usage patterns
sar -r 1 10
free -h

# Identify memory-hungry processes
htop (sort by memory)
ps aux --sort=-%mem | head -10
I/O Bottlenecks
# Monitor I/O performance
iostat -x 1 10
iotop (if available)

# Check specific device performance
iostat -x sda 1 10
Conclusion
Mastering these monitoring tools—htop, iostat, and sar—provides you with comprehensive visibility into your Linux system's performance. Regular monitoring helps prevent issues, optimize resource usage, and maintain system reliability.
Key takeaways:
- Use htop for interactive process monitoring
- Use iostat to identify storage bottlenecks
- Use sar for historical performance analysis
- Combine tools for complete system visibility
- Set up automated monitoring and alerting
Remember that monitoring is most effective when it's consistent and proactive. Establish baselines, set up alerts, and regularly review performance trends to maintain optimal system health.